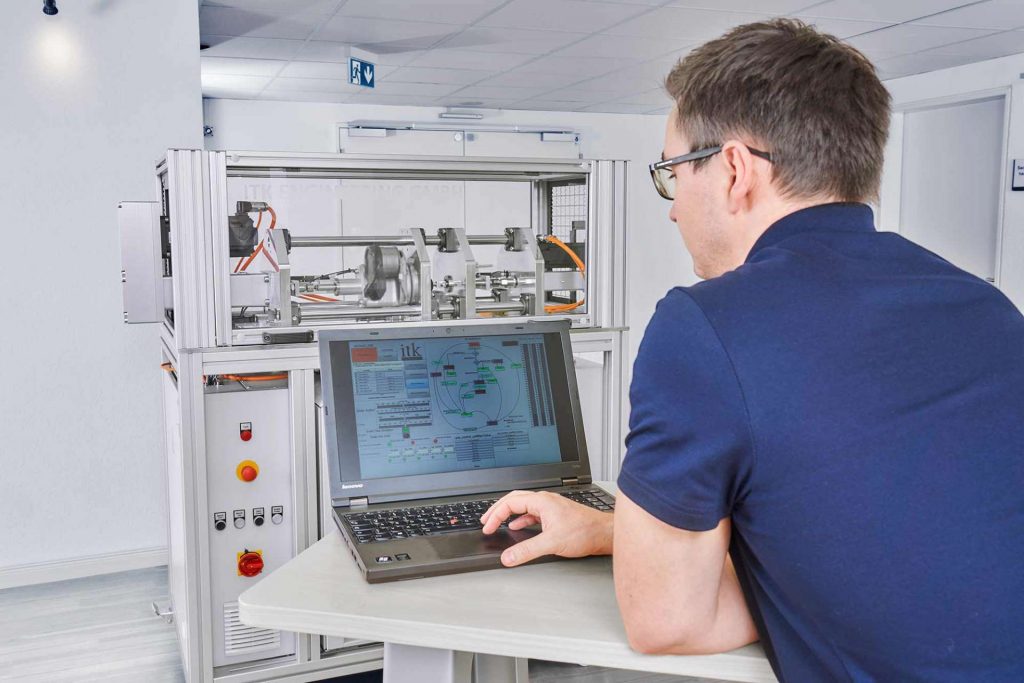
Hardware-agnostic, scalable software for measurement systems and testing processes
Optimizing measuring and testing procedures, enjoying greater flexibility and scalability, making the most of data – the key to doing all this is to integrate measuring devices from multiple vendors. However, integration comes with its own set of daunting challenges. The ITK Measurement and Testing software is here to help you rise to the occasion – and turn data capture, systems surveillance, and device management into an exercise in convenience regardless of source.
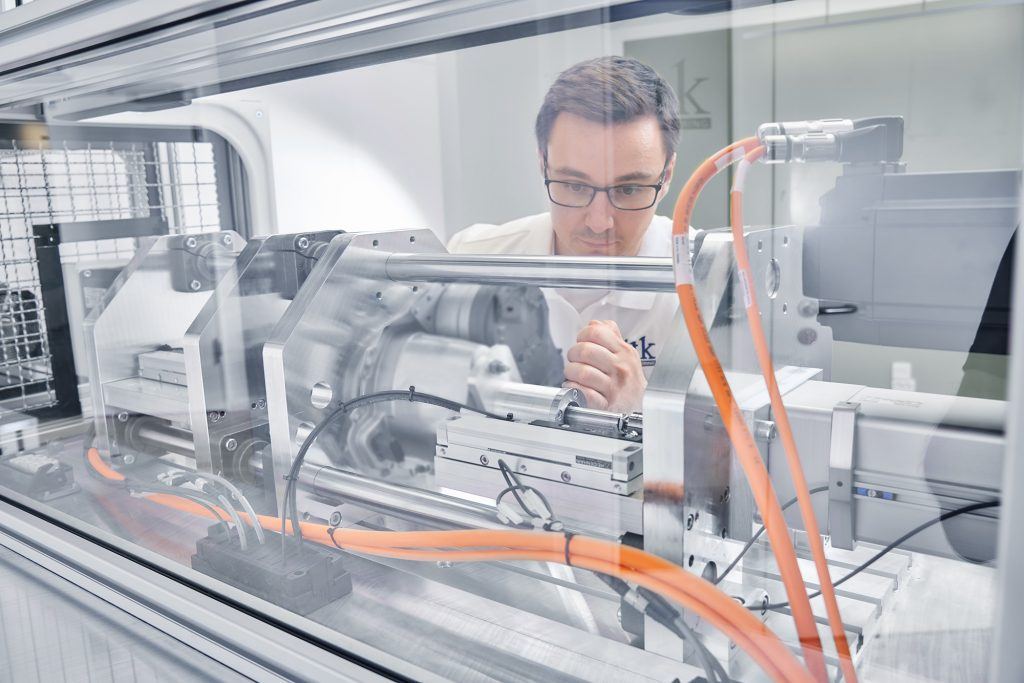
Combining different measuring tools makes sense, but poses challenges
There is a lot to be said for employing a variety of devices: Specialized instruments sold by different vendors usually come with specific features best suited for specific tasks. What’s more, a combination of devices lets you take more comprehensive readings. But this is also about upping flexibility and scalability. With more of both, you are ready to respond rapidly and flexibly to emerging requirements and changes in the measuring and testing process. If you integrate diverse devices, you will be able to scale systems to handle every task, small to large, and take even the most complex readings. Then there are benefits in terms of data consolidation and analysis to consider: Assessments are more accurate, consistent, and easier to execute when management and analysis capabilities are centralized. On top of that, analyses of consolidated data can be far more comprehensive – a bigger, better dataset yields greater insight.
There is a catch, though: Integrating multiple devices and sources is a task fraught with technical challenges. Different measuring tools communicate via different protocols and interfaces. Typically, you will need add-on hardware or software to get these devices to talk to one another. The software serving to control systems and analyze the data must also be able to deal with data from different sources. In many cases, it takes additional drivers or middleware to achieve compatibility. And if your setup incorporates multiple devices and sources, data has to be captured synchronously to obtain accurate and consistent readings.
Do you have a specific idea or project in mind?
Get in touch with us. We will be happy to support you with our expertise in measurement and testing processes – from system and software engineering to the development of turnkey testing systems.
ITK software for easy, customized integration of measuring devices and sources
Rather than being locked in with one hardware vendor, you will probably prefer to integrate third-party devices and sources as you see fit. The ITK Measurement and Testing software unlocks that door for you and puts powerful capabilities at your fingertips:
Data acquisition: Capture data simultaneously and synchronously from any source, including NI hardware, field buses, networks, and the like.
Monitoring: Combine channels and event actions to configure monitoring scenarios – for example, to monitor a machine over days and weeks.
Control: Address local and remote devices using analog and digital output channels, buses, and networks.
The The ITK Measurement and Testing software is a LabVIEW-based software framework for Windows PCs. Taking the framework as a basis, we create your specific application and integrate your interfaces and operating requirements. You do not need a LABVIEW license to run it. The software can be used both without measurement technology, or with as an end-to-end system. It is ready to go and easy to use – no programming skills required.
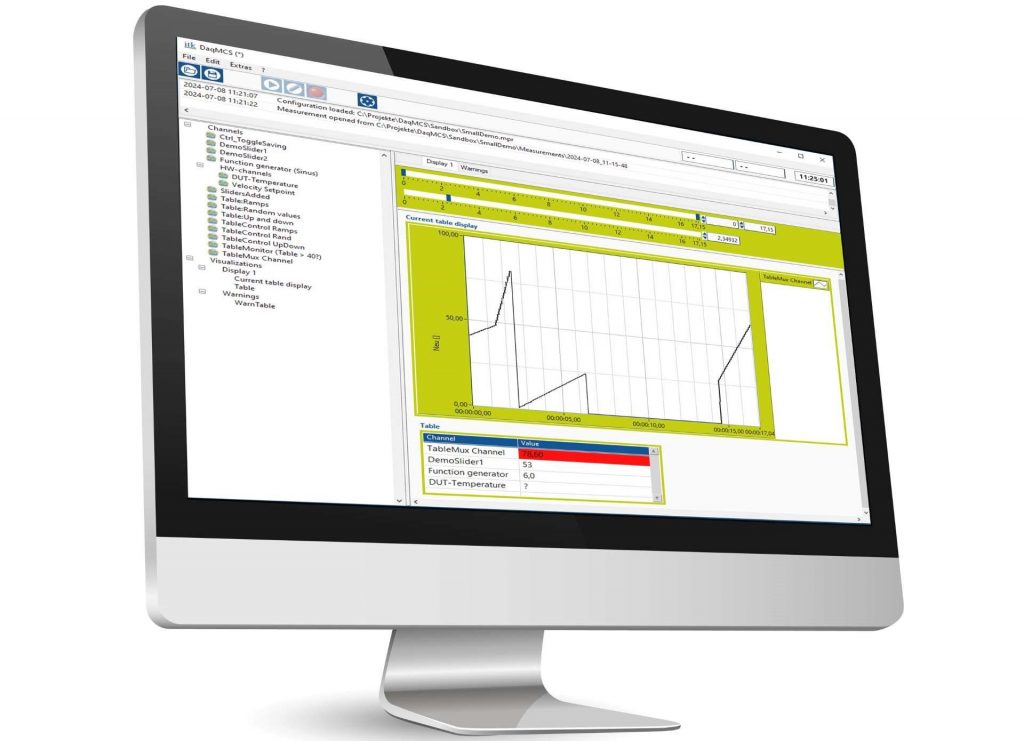
A closer look at the software
Key features
The software allows users to read and write measurement data synchronously from different sources or buses. It supports NI hardware for AI, DI, AO and DO, OPC UA, Beckhoff via ADS-API, DataSocket and Keyence line lasers. The software can be easily extended by Modbus, Agilent hardware or other fieldbuses, for example.
Whether calculating in formulas or monitoring threshold values – users can easily process measurement data further. Channels can be expanded on request.
With the software, users can generate control data (from tables, sine/rectangular signal, etc.) and display it on time records, XY charts, histograms, tables, lamps/single value displays, etc.
Test benches or devices connected to the PC can be controlled via switches, input fields and sliders. Operating sequences can be configured without changing the software.
The framework is extremely flexible. New channels, displays, events or actions can be easily expanded, sometimes even in just a few hours.
Channels
You have three types of channels available for acquiring, generating, and outputting data.
Real acquisition channels can capture values from third-party devices, use sensor readings sent via bus, or take readings from NI devices.
Virtual channels may have zero, one, or more channels as a source. They can generate sine waves, monitor thresholds, and apply formulas to compute the cross-products of multiple channels.
Output channels can use one or several channels as a source and send their values directly to an output.
Displays
You can create any number of panels or dashboards to be selected via a tab in the main window or opened in a separate window.
Different types of panels feature different types of graphical indicators, including time plots, actual value readouts, and tables. You may configure these displays as you see fit.
Assign one or more channels, depending on the type of panel. The sliders and buttons generate channel data of their own that can be combined in any way, just like all other channels in the software.
Events & actions
Events are freely configurable, unlimited in number, and can be triggered by multiple sources.
You can define an unlimited number of actions for each event. For example, you could have the software generate a log entry and start storing data when a measured channel’s readout exceeds a threshold value and stop storing it when the value drops below the threshold.
Data storage in TDMS format
This software stores measurement data in TDMS format. You can access and analyze stored data in the software by way of an assessment project. You can also load it to other analytics tools that can handle TDMS, such as NI Diadem.
TDMS files can serve a playback channel that simulates the TDMS file’s data when you take a reading. This lets you do things like compare the curve of a previously graphed reading with the current curve.
We can also implement other formats to suit your needs. On-demand formats can then co-exist with the standard format.
Flexible, customizable software for measurement systems and testing processes
Optimize your measuring and testing processes, increase flexibility and scalability, and make the most of your data with the The ITK Measurement and Testing software.
Enjoy the benefits of effortless data collection, system monitoring, and management with the The ITK Measurement and Testing software. Compatible with multiple vendors’ measurement equipment and a variety of data sources and sinks, it lets you easily integrate, manage, and analyze all your data. Customize channels, displays, and actions to suit your requirements with no coding skills needed. Opt for this solution to squeeze every drop of value from your data.
This software easily scales to any size. And if the current feature set is not a perfect fit for your unique requirements, we will be happy to customize the software for you at a reasonable cost.
Request the demo version
Test our demo version of the ITK Measurement and Testing software free of charge and without obligation. The demo comes with the full set of features, but limited measuring time. Please let us know which functions you require so that we can send you the installer in a compact size and customised to your needs.